Portfolio
Here, you’ll find a selection of projects that I’ve have worked on or am currently engaged with. My work spans across various fields including Natural Language Processing (NLP), Explainable AI (XAI), Large Language Models (LLM), classification techniques, and data visualization.
COMPONENTS:
- Limited Engagement
- Supporting Contributor
- Lead Developer / Contributor
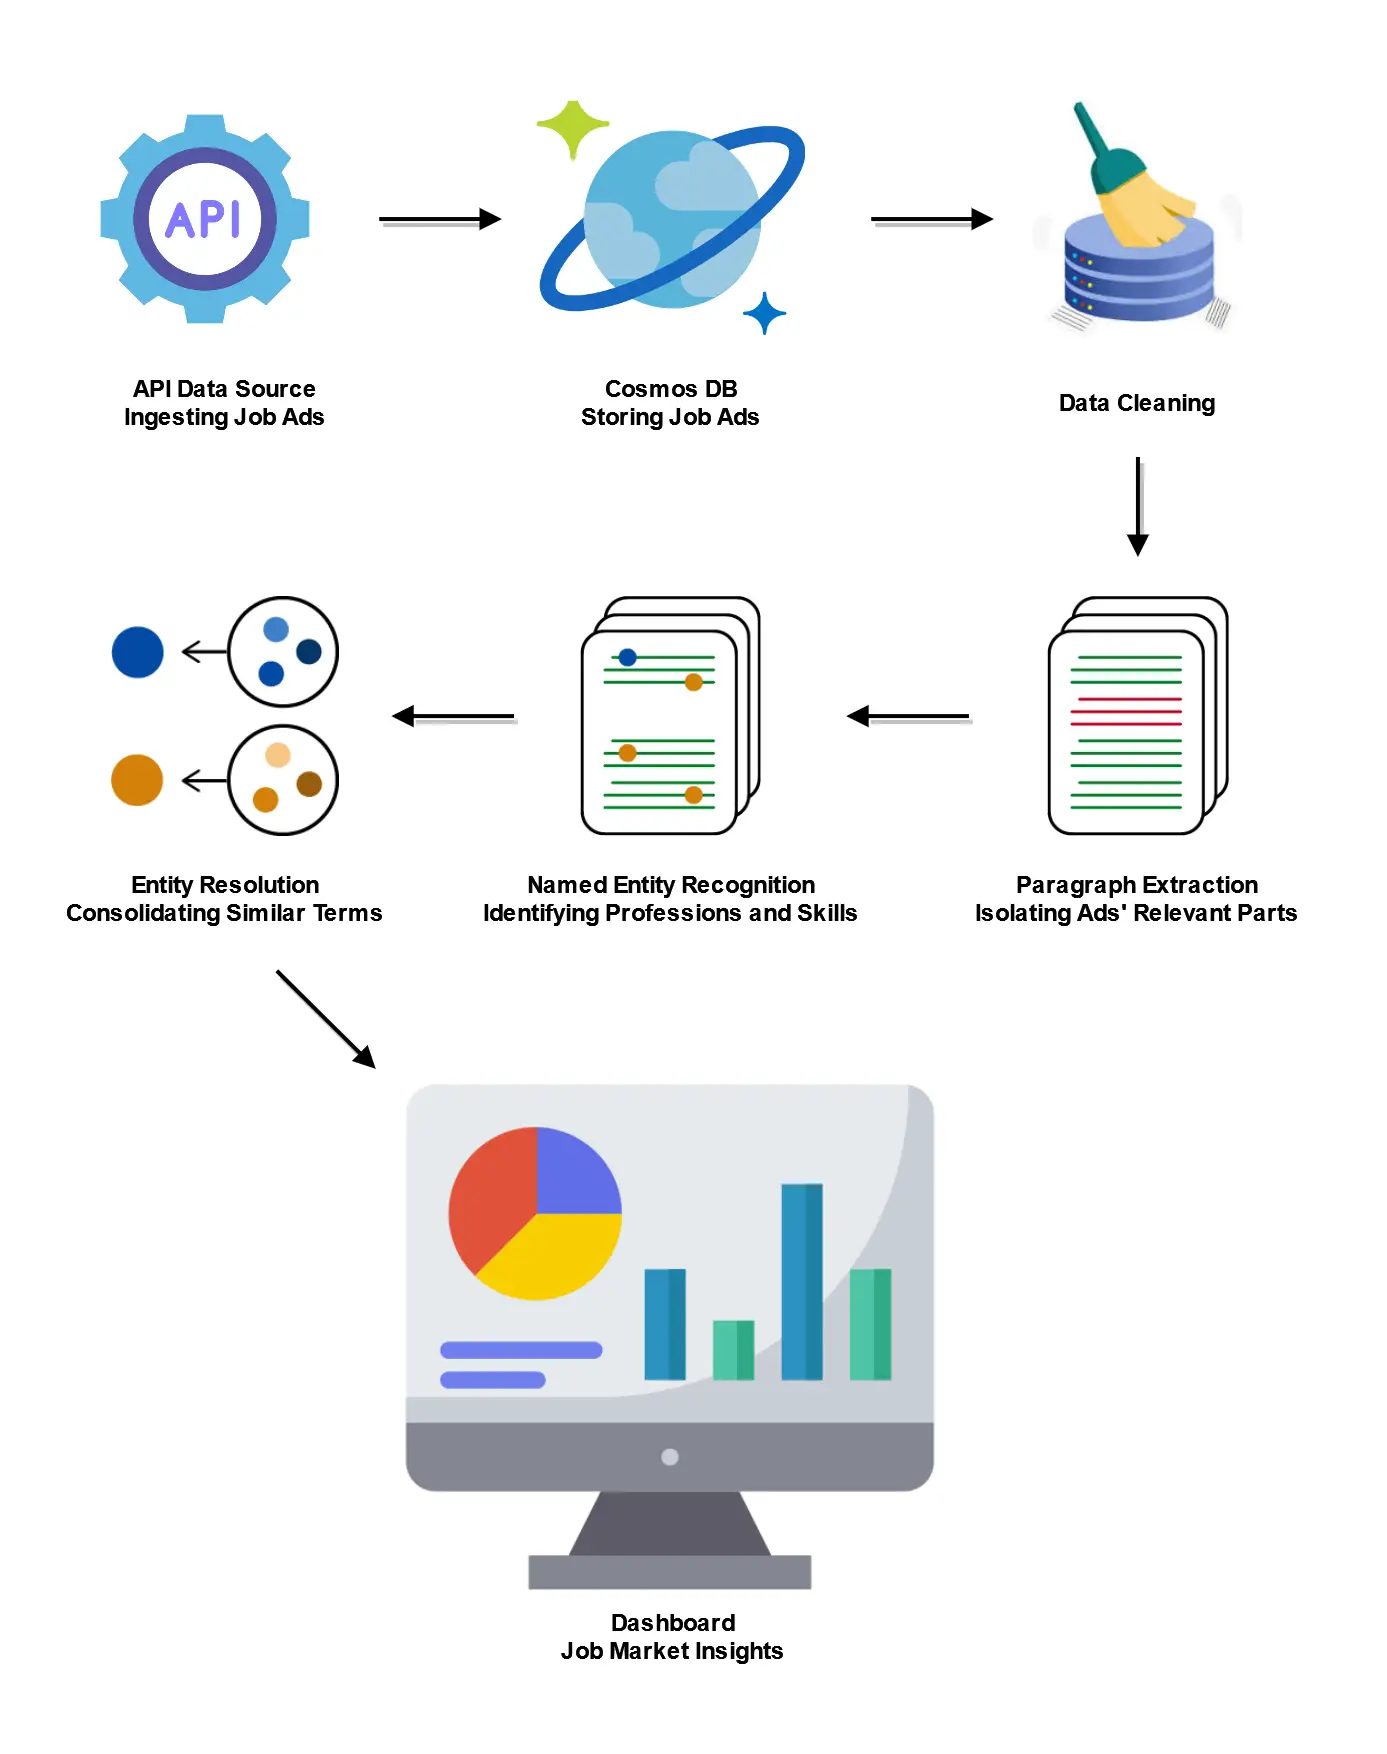
1.Data ingestion and storage: Data is collected from API and stored to the database
2.Data cleaning: The dataset is analyzed and errors or inconsistencies are corrected where possible. Irreparable entries are logged and discarded
3.Data labeling and preparation: Data is labeled and prepared for model training
4.Relevance extraction: Model is trained to extract the relevant paragraphs from job ads
5.Named Entity Recognition (NER): Model is trained to extract the skills and professions from the job ads
6.Post-Processing and matching: The extracted skills and professions are matched to a body of knowledge to ensure terminological consistency
7.Dashboard visualization: A dashboard to display and interact with the data
TECHNOLOGIES, TECHNIQUES:
Cosmos DB, Azure DevOps, Docker, Git, Label Studio
Python, spaCy, Transformers, Annoy, Panel (Holoviz)
Agile Project Management
IMPACT AND OUTCOMES:
Successfully deployed, the pipeline robustly processes over 40,000 job advertisements daily. The product enabled the end user to take strategic decisions based on current job market, skill demands, and emerging trends.
INTERPRETABLE RESPONSE ENGINE
PROJECT DESCRIPTION:
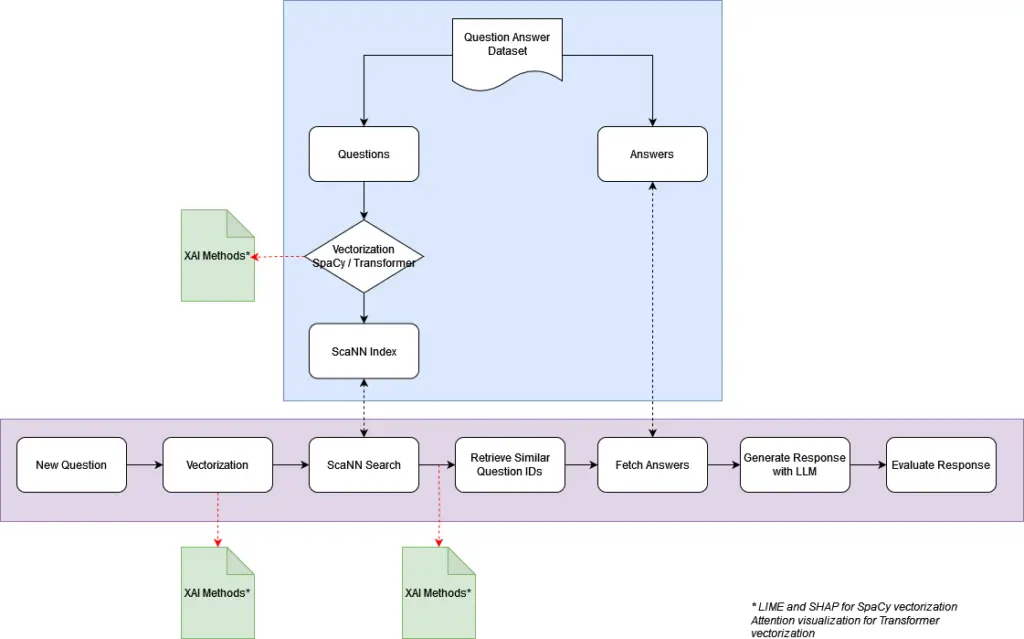
A RAG system designed to match user queries with similar historical questions from a Q&A database, and generate responses with the context of the top answers. A unique aspect of this system, is the emphasis on explainability, a critical component for more transparent outputs.
COMPONENTS:
1.Data preparation and vectorization: All questions from the database are vectorized and indexed.
2.New question vectorization: User queries are vectorized for semantic analysis.
3.Similarity Search: The most relevant questions are found based on similarity search.
4.Context Enrichment: Top answers from matched questions are retrieved to provide the sources for the answer.
5.Response Generation: The context and original query are fed to a Large Language Model (LLM) and context-aware responses are generated.
6.Explainability Module: The responses are accompanied by evidence that the context fed to the LLM was relevant to the original query.
7.User Interface: A user-friendly interface that allows for easy query submission and displays both the generated response and its explanation.
TECHNOLOGIES, TECHNIQUES:
Docker, Google Cloud, Flask, LLM API, Git
Python, spaCy, Transformers, ScaNN
Explainable AI (XAI), RAG
IMPACT AND OUTCOMES:
Under Development
AUTOMATIC CLASSIFIER
PROJECT DESCRIPTION:
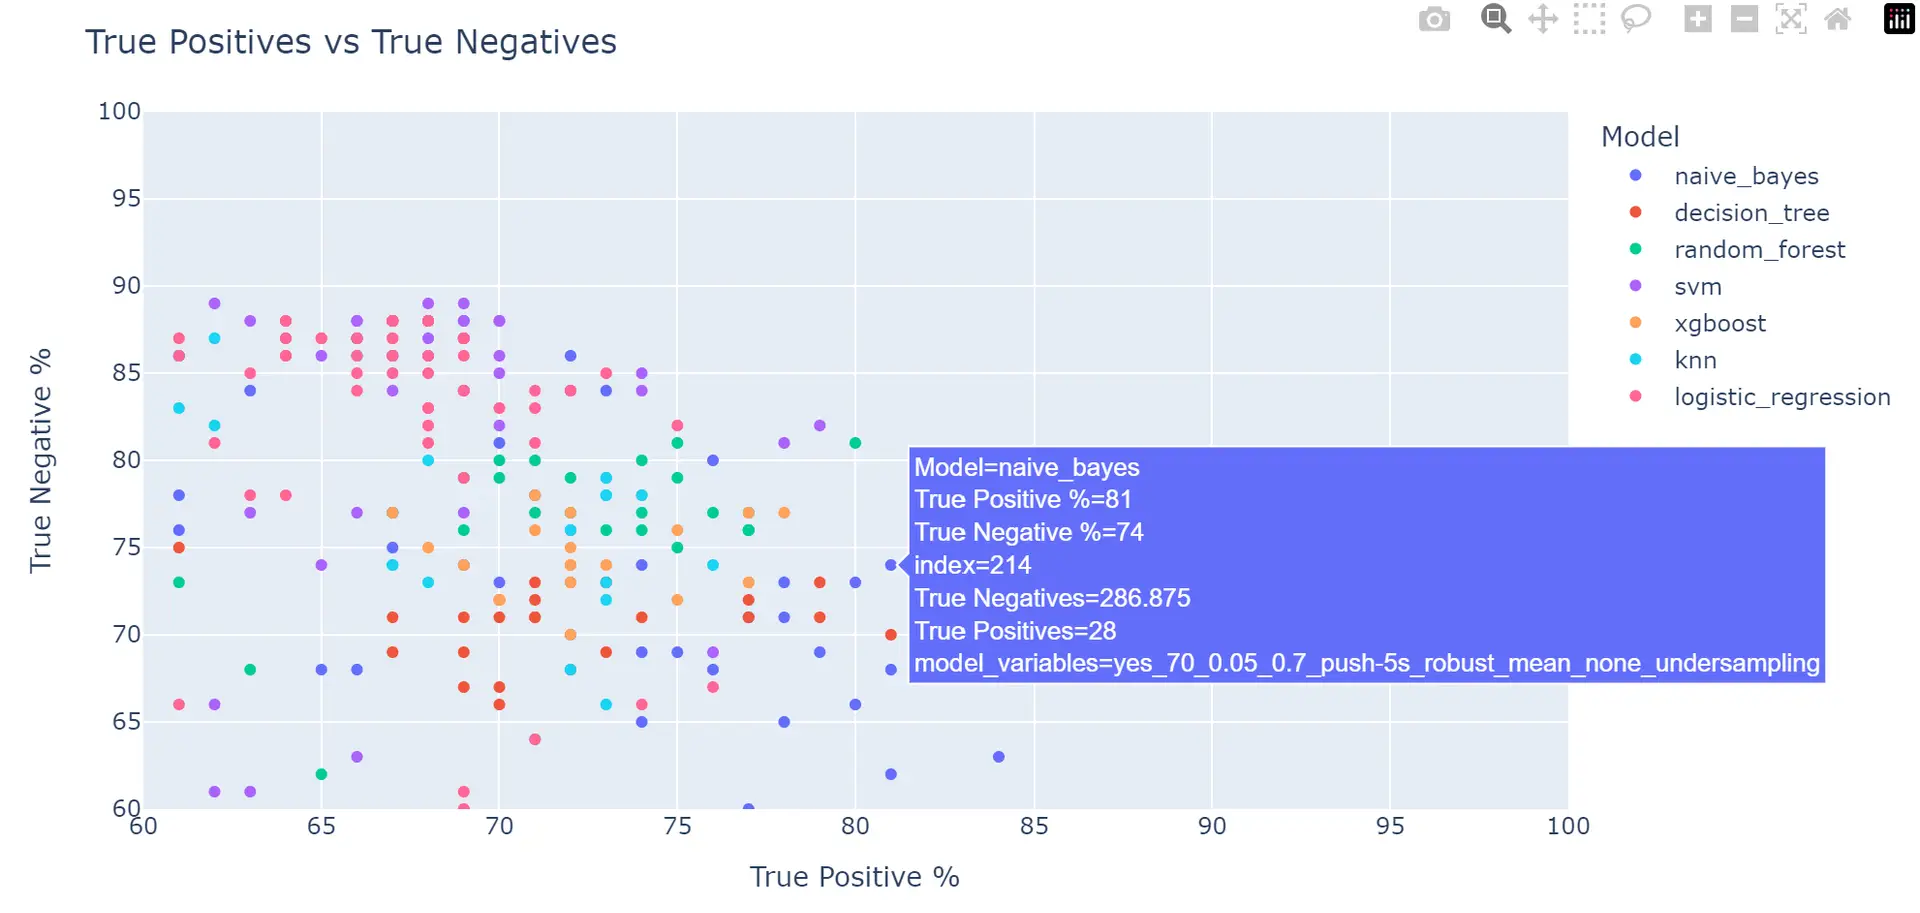
Inspired by AutoML, this is a script that systematically applies feature engineering, multiple imputation methods, outlier handling techniques, scaling methods, dimensionality reduction strategies, imbalance treatment, and evaluates seven different classifiers. The objective is to identify the optimal combination that yields the highest scoring in predictive modeling, catering to varied datasets.
COMPONENTS:
1.Feature removal: Removing features depending on various combinations of thresholds for missing values, variance, and correlation.
2.Outlier handling: Ignoring, removing, or pushing the outliers to various thresholds.
3.Scaling: Not scaling the data or applying either Standard, Min Max or Robust scaling.
4.Imputation: Imputing the missing data with mean, median or more advanced methods like mice and kNN.
5.Imbalance Treatment: Applying SMOTE, ROSE or Random Undersampling to deal with imbalanced datasets as an additional alternative to setting weights to the classifiers.
6.Feature Selection / Reduction: Not using dimensionality reduction techniques or applying either PCA, RFE, Boruta or Lasso.
7.Classifiers: Using one of the following classifiers: Decision Tree, Random Forest, Logistic Regression, kNN, SVM, Naive Bayes, XGBoost
8.Hyperparameter tuning: Selecting the best performing combinations for each of the classifiers, and tune their hyperparameters using a validation set.
9.Evaluate the models: Evaluate the models with the test set.
TECHNOLOGIES, TECHNIQUES:
Python, Plotly
IMPACT AND OUTCOMES:
Evaluated across various datasets, this script has proven to be a reliable and effective tool for surpassing baseline predictions.
VISUALIZATION PROJECTS
PROJECT DESCRIPTION:
An interactive warehouse dashboard with features like help overlay, dynamic date selection, drilldown graphs, hover product information etc.
TECHNOLOGIES, TECHNIQUES:
Tableau, PostgreSQL
PROJECT DESCRIPTION:
An interactive sales dashboard featuring a geographic map for city-filtering, expandable graphs, tabular data, with the option to download them to PDF.
TECHNOLOGIES, TECHNIQUES:
Tableau
SMALL PROJECTS
PROJECT DESCRIPTION:
A Flask-based web application that assesses and rates the toxicity levels of text in both German and English, provided through an Excel file.
TECHNOLOGIES, TECHNIQUES:
Python, Flask, Perspective API
PROJECT DESCRIPTION:
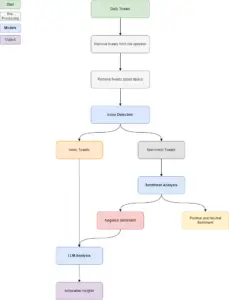
This project analyzes daily customer-generated tweets about a train service to identify common complaints and gauge sentiment, utilizing NLP techniques for irony detection and sentiment analysis, and categorizing feedback for actionable insights.
TECHNOLOGIES, TECHNIQUES:
Python, X API, NLP libraries, LLM API
Power BI


